
Youth Voting and Civic Engagement in America
There is a two-way relationship between the electoral and civic participation of young people in the United States, and the political, socioeconomic, and community conditions in the places where youth live. Context matters: income disparity, racial segregation, education level, political polarization, and the work of nonprofits—among many others—make up the “civic ecosystem” in which youth do or do not have the opportunities to participate in civic and democratic life, or to build the knowledge, skills, and understandings necessary to do so. At the same time, research has shown that communities where young people vote, volunteer, help their neighbors, and belong to groups or associations can be more prosperous and resilient places. These dynamics are multifaceted and far from straightforward; it is essential to understand them in order to help advanced more and more equitable civic opportunities for youth.
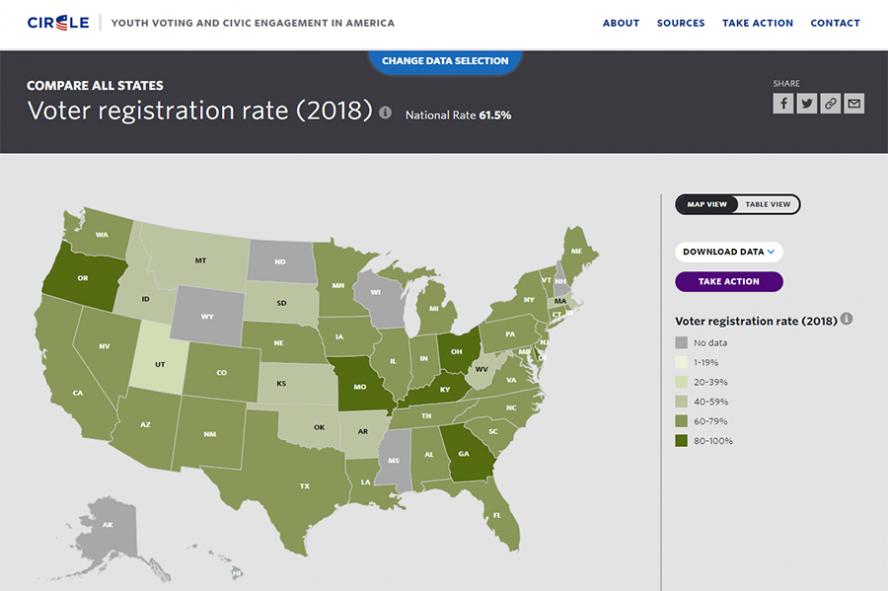
CIRCLE’s exclusive data tool, Youth Voting and Civic Engagement in America, offers a unique way to explore the relationships between voting and other forms of civic participation, and some of the conditions that shape such engagement. The tool features more than 40 unique indicators, and it includes data at the national, state, congressional district, and county levels. Users of the tool will find:
- Youth voter turnout and vote choice in recent elections for all geographic levels
- Rankings of the states and districts where young people may have influenced election results
- State-level data on 10 indicators of youth civic engagement, including volunteering, discussing political issues, and contacting public officials
- County-level data on youth educational attainment, broadband access, income disparity, residential segregation, the nonprofit sector, and other elements that may influence civic participation
Note: While you can access and explore the tool on tablets and mobile, for the best experience we recommend you use a laptop or desktop computer.
How to Use the Tool
We hope you find our data tool intuitive and easy to use, but here’s a quick guide to help you get started:
- Which Measures Do You Want to See? There are broadly two types of data in the tool: data on youth voting and civic participation, and data on many community conditions that shape civic engagement. You can select up to three data points from each “side” to visualize. Additionally, for data related to voting and elections, you can select the election year.
- Note that not all data is available at every geographic level (i.e., some data points can only be selected for a state but not for a county, or vice versa). Unavailable selections will be grayed out. If you’re interested in a particular unselectable data point, switch to a different geographic level. When data is not available at a particular geographic level, there are a few reasons why this could be the case: 1) Sample sizes in the particular dataset that we used do not allow for it or the dataset was not created for that purpose, 2) The dataset that we used did not have the ability to do the calculation at that geographic level (as is most often the case with Congressional Districts), or 3) Reliable data by age is not available (as is the case with several states’ election data).
- Visualize: The tool will visualize your selected data points. Where available, it will display relevant state and/or national rates for the sake of comparison. You can download the data, share it on social media, or go back and make different selections.
- Find More Research; Take Action: Throughout the tool, as you view data at different levels, you’ll find additional links and information that link what you’re seeing to the rest of our work. That includes related research items so you can read more about the importance of particular data or dynamics, and action ideas that suggest ways you can leverage our data to advocate for and advance stronger youth civic engagement in your own community. We've also created a special resource for teachers with suggestions for how to use the tool for various classroom activities.
On April 2, 2020 we hosted a webinar about the tool. You can watch it below:
More About the Tool
Learn more about our data: why we selected it, why it's important, and where it comes from.
With more than 30 measures and information about youth voting across multiple elections, this tool provides a more comprehensive perspective on young people’s civic engagement in America. That said, we recognize that there are other important indicators that can be used to examine and advance youth participation. Our choices are based largely on data availability and we wish more data was available, especially on issues like the intersection of media and youth engagement. The selected data also reflects our understanding, based on years of research and work with practitioners, of key elements that measure and influence young people’s civic engagement:
- Youth Voting: While it’s far from the only way young people can shape democracy, voting is a fundamental act of civic participation. Because elections happen regularly and everywhere, in theory they provide all youth opportunities to participate and to have an impact on the issues and communities they care about. The fact that young people tend to vote at lower rates than older adults, and that there are racial/ethnic, educational, and other disparities in voting rates among youth, is an essential challenge in creating a more equitable democracy.
- Youth Civic Engagement: There are many ways for young people to engage in civic life and contribute to their communities. Volunteering and doing favors for neighbors are ways for young people to develop key civic skills and attitudes while having a tangible impact. Talking about issues with friends and neighbors is crucial for young people to become engaged and informed, and to help promote a culture of interest in political and civic life.
- Youth Population: In places where there are a lot of young people, and/or where they make up a relatively high proportion of the population, youth can have an especially strong influence on elections. They may also find it easier to engage in peer-to-peer conversations and organizing that can be crucial to their civic development.
- Education: Educational attainment often correlates with access and opportunities to participate in civic life. For example, a lot of youth outreach is conducted on college campuses. On the other hand, young people who have not attended college have historically been marginalized from political life and face additional structural challenges to civic learning and engagement.
- Quality of Life: The socioeconomic conditions in a community inevitably shape the context and opportunities, or too often the lack thereof, for residents to engage in civic life. Our research has previously found systemic issues in access to opportunity as a result of these conditions. For example, there is a correlation between household income and the quality of civic education students receive at school, as well as access to valuable extracurricular activities. Other indicators, like broadband internet access, have direct implications for young people’s ability to access information, connect with peers, create media, and engage with an increasingly important online ecosystem for civic participation.
- Civic Culture: Myriad aspects make up a community’s civic culture; our data tool highlights just a few relevant indicators. The presence of organizations and nonprofits in a community, especially those that serve youth, provide opportunities for engagement, skill-building, and social impact. Residential stability can influence young people’s ability to form important community ties, and residential segregation may affect young people’s ability to navigate, learn from, and build networks with people of different backgrounds.
- Political Landscape: Young people vote at higher rates when they feel they have a stake in the outcome of an election—and the capacity to shape that outcome. The partisan makeup of a community, the competitiveness of races can influence youth engagement at the ballot box and beyond. Other factors, like electoral laws and statewide statutes on facilitating voter registration, can also affect the ease and accessibility of the voting process for youth.
The data in our Youth Voting and Civic Engagement in America tool comes from a variety of sources. You can learn more about the specific source for each indicator below:
Have a question about the data or want to learn more about how you may use it? Email us: circle@tufts.edu.