
The Youth Vote in 2022
Elections are a valuable opportunity for young people across the country to make their voices heard, support action on issues they care about, and grow as active voters and leaders in our democracy. Our research on the youth vote in the 2022 midterm election highlights how young people used their power, and the work that's still needed to ensure all youth are ready to participate in elections.
Final Estimates of Youth Turnout in 2022
In April 2023 CIRCLE released its final estimates of youth voter turnout nationally and for 40 states. These estimates are based on voter file data aggregated by Catalist, as opposed to our earlier, exit-poll based estimates from immediately after the 2022 election. Our key data and findings:
-
National Youth Turnout: 23% - That's lower than in the historic 2018 cycle (28%) which broke records for turnout, but much higher than in 2014, when only 13% of youth voted.
-
Top Turnout States: Michigan had the highest youth turnout in the country (37%), with Minnesota, Maine, Oregon, and Colorado also above 30%.
-
Lowest Turnout States: Oklahoma, Alabama, Indiana, West Virginia, and Tennessee all had youth turnout at or below 15%.
-
Election Policies Matter: Many of the states with the highest youth turnout have policies like automatic and same-day registration that make it easier for young people to register and vote. Many of the states with lower turnout do not have these policies in place or have restrictions like voter ID laws.
-
Four States Surpassed 2018: Michigan, Pennsylvania, New York, and Arkansas were the only states to have a higher youth turnout in 2022 than in 2018. In those first three states, Democrats won competitive statewide races for governor and/or U.S. Senate.
-
Upward Trend Since 2014: All but one state for which we have data (Louisiana) had higher youth turnout in 2022 than in 2014, suggesting a broad trend of increased youth voting over the past decade.
Explore state-by-state youth turnout in the map below, and find our full data and analysis here.
Post-Election Data on Youth Turnout and Impact
Please note that all of the data and analysis below is based on exit poll data immediately available following the election in November 2022. You can find updated analyses, including a more recent estimate of national youth voter turnout based on voter file data, at this link.
Based on exit poll data immediately available following the 2022 midterm elections, we estimate that 27% of youth (ages 18-29) cast a ballot in 2022, making this the midterm election with the second-highest youth voter turnout in almost three decades. We also estimate that youth turnout was even higher in some battleground states.
After hovering around 20% turnout in midterm elections since the 1990s, young people shifted that trend in 2018 and largely maintained that trend in 2022, with more than a quarter of young people casting a ballot. Youth are increasing their electoral participation, leading movements, and making their voices heard on key issues that affect their communities.
CIRCLE also estimates that, in a group of nine electorally competitive states for which exit poll data is available (FL, GA, MI, NC, NH, NV, OH, PA, WI), the aggregate youth voter turnout was 31%. These are early estimates of youth voter turnout that may shift in the coming days.
Read more
Youth Prefer Democrats by 28-Point Margin
According to the Edison Research National Election Pool exit poll, the national youth vote choice for the U.S. House of Representatives was 63% for Democrats, 35% for Republicans. That’s almost identical to 2020, when youth preferred Democrats to Republicans by 62% to 36%, and a small shift in favor of Republicans from the previous midterm: in 2018, the youth vote between Democrats and Republicans was 67% to 32%—which was the largest margin ever for Democrats among young voters.
According to this exit poll data, youth ages 18-29 are the only age group in which a strong majority supported Democrats. Voters ages 30-44 split their votes nearly evenly 51%-47% between Democrats and Republicans, while older voters favored the GOP. The youth share of all votes cast is 12%, on par with the 13% youth share from the 2018 midterm election. Vote choice and share data may continue to shift in the coming hours.
Young voters are not a monolith, and their vote choice varies widely by gender, race/ethnicity and other factors. Our analysis of national youth vote for U.S. House candidates by various demographic groups highlights:
- The vote choice of young women was 71% for Democrats, 26% for Republicans, compared to 53% vs. 42% by young men.
- Youth of color backed Democrats by larger margins than white youth: 87% of Black youth and 67% of Latino youth voted for a Democratic House candidate, compared to 57% of young white voters. Young women of color were even more likely to vote for Democrats.
- Young voters who identify as LGBT gave Democrats extraordinary support: 93%, compared to just 5% for Republicans.
- There was a big urban/rural divide in youth vote choice: young voters from small towns or rural areas backed Republicans: 64% vs. 33%.
Read more
Youth participation and party preference can also vary by state. Based on data from states where exit polls were conducted, here’s what the youth vote choice and youth share of the vote looked like in key electoral battlegrounds. (Note: the youth share of the vote is the percentage of all votes cast in a race that were cast by young people, ages 18-29.)
In close elections decided by a few percentage points, young voters’ double-digit vote margin for Democrats can swing a race in which older voters backed the Republican candidate:
- In the Pennsylvania Senate race, where Democrat John Fetterman won by a slim 3% margin, youth ages 18-29 preferred Fetterman 70% to 28%, compared to 55% to 42% among voters ages 30-44, with voters over 45 preferring Republican candidate Dr. Oz.
- In the Wisconsin Governor election, which we had ranked as the #1 race where the youth vote could influence the outcome, Democratic Governor Tony Evers won reelection by a slim margin, 51% to 48%. Young voters gave Evers extraordinary support: 70% vs. 30% for Republican challenger Tim Michels. Voters 30-44 also preferred Evers by a slimmer 55% to 44% margin, while voters over 45 backed the GOP candidate.
- In the Georgia Senate race that will go to a runoff election, with less than 1% separating the candidates, youth backed Democratic incumbent Senator Warnock 63% to 34%. Voters ages 30-44 backed Warnock 56% to 41%, while voters over 45 gave a majority of their votes to GOP challenger Herschel Walker. Notably, the youth share of the vote in Georgia was 13%, slightly higher than the national rate.
Read more
As in every election, young people were motivated to vote by a range of issues; and different youth may prioritize and view those issues differently based on their identities and experiences. Our analysis of Edison Research National Election Pool exit poll data sheds light on the issues youth cared about most and how it shaped their vote choice. We find that young voters were the only age group to cite abortion as the issue that most influenced their vote; 80% of youth who want abortion to be legal voted for a Democrat; and 89% of youth who want it to be illegal voted for a Republican.
Read more
Young voters in 2022 differed from older voters in their views on democracy, the legitimacy of elections, and their affiliation to political parties. For example, young voters were the most likely to say (71%) that President Biden was legitimately elected in 2020. compared to 65% of voters ages 30-44 and less than 60% of voters over 45. In addition, almost two in five (38%) of young voters identify with neither the Democratic nor Republican parties, with important differences within youth by race and ethnicity.
Read more
There are stubborn ongoing inequities in who participates in elections. Some youth of color and other young people, like those without college experience, who have fewer opportunities for electoral learning and engagement, often participate at lower rates. This can lead to them being underrepresented in the electorate relative to their share of the population, which prevents us from having a truly equitable and inclusive democracy.
Our analysis of young voters in 2022 found that white youth—especially white women—were overrepresented among youth who cast a ballot, while Black men were underrepresented. In addition, only 12% of youth who voted in 2022 have no college experience, despite that group making up 40% of the population.
Read more
Latest 2022 Research
Race and Rurality Shape the Impact of Facilitative Election Laws
Local Media Access and Consumption Can Support Youth Civic Engagement
Young Voters in 2022 by Race/Ethnicity
Pre-Election: In-Depth Analyses
Ahead of the 2022 midterms, CIRCLE tracked the state of youth voter registration in 2022 and how it compares to the 2018 midterm cycle. Our final analysis of youth voter registration, calculated using voter files aggregated by Catalist, offered some reasons for optimism: the number of young people (18-24) registered to vote before the 2022 election was higher than in November 2018—especially in major battleground states and states, like Michigan and California, where abortion was on the ballot.
Read more
There were an estimated 8.3 million newly eligible young voters for the 2022 midterm elections—meaning, youth who have turned 18 since the previous general election in November 2020. These 18- and 19-year-olds comprise 16% of the 18-29 age group for the 2022 election. They include approximately 4.5 million white youth and 3.8 million youth of color: 2 million Latinos, 1.2 million Black youth, 500,000 Asians, and 80,000 Native Americans.
Read more
The 2022 midterm election was really many elections happening in all 50 states and Washington, D.C., in the context of vastly different laws governing voter registration, mail-in voting, and more. Our scan and analysis of election policies across the country paints a picture of where it is easier or harder to register and cast a ballot, including new laws passed since 2020—some of which have eased access to voting, while others have restricted it.
Read more
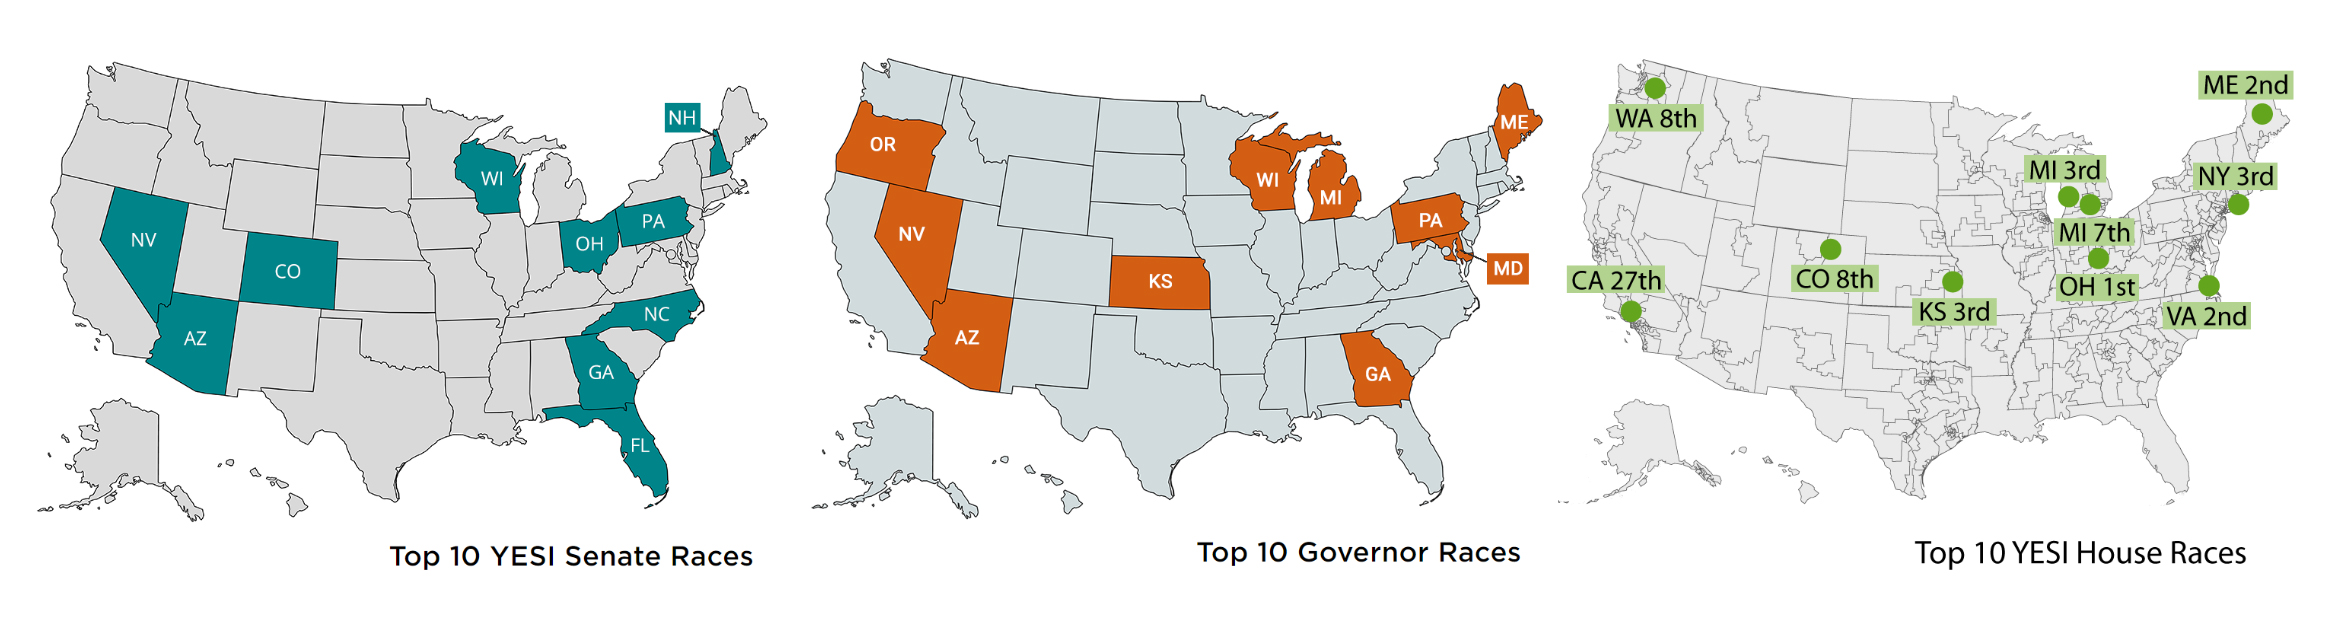
Youth Electoral Significance Index (YESI)
CIRCLE's Youth Electoral Significance Index (YESI) is a set of data-based rankings of the races in which we projected youth had the highest potential to decisively shape 2022 election outcomes. Based on more than a dozen indicators of youth demographics, registration rates, past turnout, and various other aspects of the local context in each state. the YESI highlights young people's massive electoral power and provides campaigns, organizers, and other stakeholders with a guide to where their outreach and resources can be most influential.
Read more